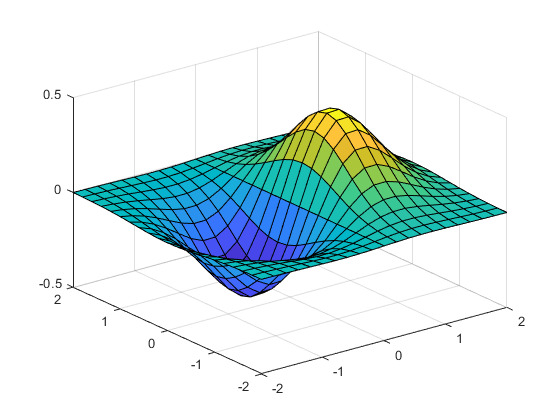
Three-dimensional plots typically display a surface defined by a function in two variables, z = f(x,y) . To evaluate z, first create a set of (x,y) points over the domain of the function using meshgrid. >> [X,Y] = meshgrid(-2:.2:2); >> Z = X .* exp(-X.^2 - Y.^2); Then, create a surface plot. >> surf(X,Y,Z)
Read more