

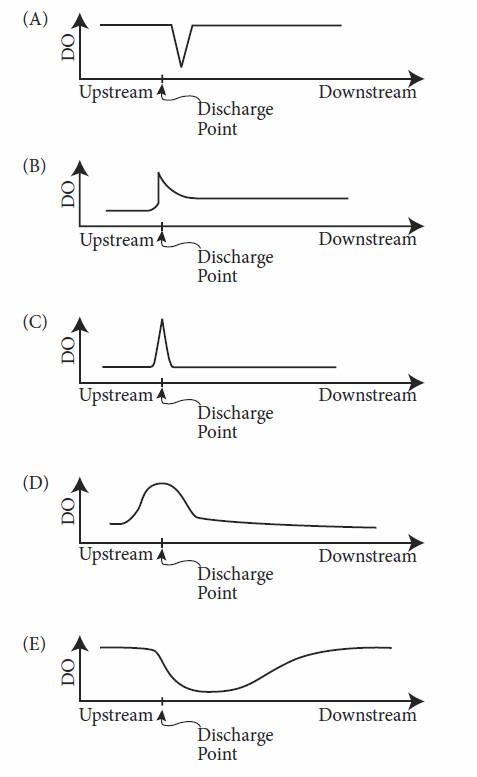
A point source discharges organic waste into a stream. Which of the following graphs best depicts the expected pattern for dissolved oxygen (DO) in this stream as a function of distance from the discharge point?
A point source discharges organic waste into a stream. Which of the following graphs best depicts the expected pattern for dissolved oxygen (DO) in this stream as a function of distance from the discharge point?
Staff members are responsibles,both morally and legally, for the data and documents or any other material on their websites.